1,267 posters, 47 videos, 13 topics, 4 sessions, 853 authors
ePostersLive by SciGen Technologies S.A. All rights reserved.
SOHO 2026 Annual Meeting
September 9 - 12, 2026 | George R. Brown Convention Center, Houston, Texas

MM - 455
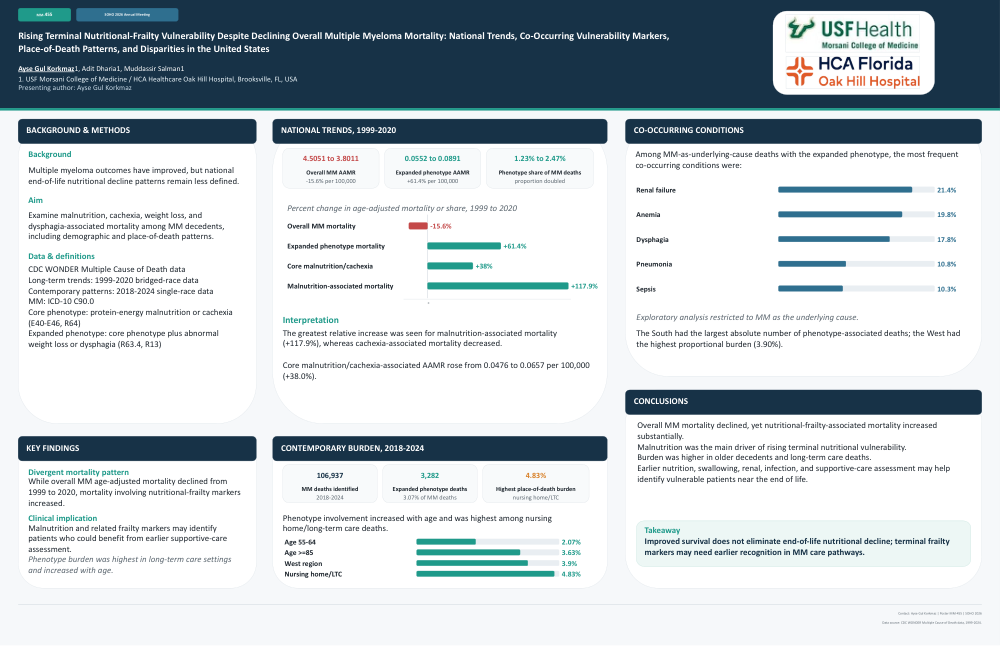
Rising Terminal Nutritional-Frailty Vulnerability Despite Declining Overall Multiple Myeloma Mortality: National Trends, Co-Occurring Vulnerability Markers, Place-of-Death Patterns, and Disparities in the United States
Poster Presenter
Authors
Part of Topic
Multiple Myeloma (MM)
Abstract
Background
Multiple myeloma (MM) outcomes have improved over time; however, less is known about national trends in
nutritional decline near the end of life. We examined malnutrition, cachexia, weight loss, and dysphagia-associated
mortality among MM decedents and evaluated contemporary demographic and place-of-death patterns.
Methods
We used CDC WONDER Multiple Cause of Death data. Long-term trends were assessed using 1999–2020
bridged-race data, and contemporary patterns were evaluated using 2018–2024 single-race data. MM was
defined by ICD-10 code C90.0. Core nutritional vulnerability was defined as co-mention of protein-energy
malnutrition or cachexia (E40–E46 and R64). An expanded nutritional-frailty phenotype additionally included
abnormal weight loss and dysphagia (ICD-10: R63.4 and R13). We assessed mortality rates, the proportion of MM
deaths involving this phenotype, place of death, demographic/geographic patterns, and selected co-occurring
conditions.
Results
From 1999–2020, 294293 MM-associated deaths were identified. Overall MM age-adjusted mortality decreased
from 4.5051 to 3.8011 per 100000 (-15.6%). In contrast, expanded nutritional-frailty phenotype-associated MM
mortality increased from 0.0552 to 0.0891 per 100000 (+61.4%), and the proportion of MM deaths involving
this phenotype increased from 1.23% to 2.47%. Core malnutrition/cachexia-associated mortality increased from
0.0476 to 0.0657 per 100000 (+38.0%). This increase was primarily driven by malnutrition-associated mortality,
which rose from 0.0274 to 0.0597 per 100000 (+117.9%), whereas cachexia-associated mortality decreased.
In 2018–2024, 3282 of 106937 MM deaths involved the expanded phenotype (3.07%). Phenotype involvement
increased with age, from 2.07% among decedents aged 55–64 years to 3.63% among those aged ≥85 years,
and was highest among nursing home/long-term care deaths (4.83%). The West had the highest proportional
burden (3.90%), while the South had the largest absolute number of phenotype-associated deaths. In exploratory
analyses restricted to MM as the underlying cause, frequent co-occurring conditions included renal failure
(21.4%), anemia (19.8%), dysphagia (17.8%), pneumonia (10.8%), and sepsis (10.3%).
Conclusion
Despite declining overall MM mortality, mortality associated with nutritional decline increased substantially.
These findings suggest that malnutrition and related frailty markers remain underrecognized end-of-life burdens
in MM and may identify patients who could benefit from earlier supportive care assessment.
CDC WONDER: Centers for Disease Control and Prevention Wide-Ranging Online Data for Epidemiological
Research, ICD-10: International Classification of Diseases, 10th Revision, MM: multiple myeloma
Keywords
MM, multiple myeloma, nutritional vulnerability, malnutrition, end-of-life care, mortality disparities