1,267 posters, 47 videos, 13 topics, 4 sessions, 853 authors
ePostersLive by SciGen Technologies S.A. All rights reserved.
SOHO 2026 Annual Meeting
September 9 - 12, 2026 | George R. Brown Convention Center, Houston, Texas

MPN - 234
Epigenetic Mutations as Markers of Clonal Evolution and Potential Guides for Therapy Selection in Ph-Negative Myeloproliferative Neoplasms
Poster Presenter
Authors
Part of Topic
Myeloproliferative Neoplasms (MPN)
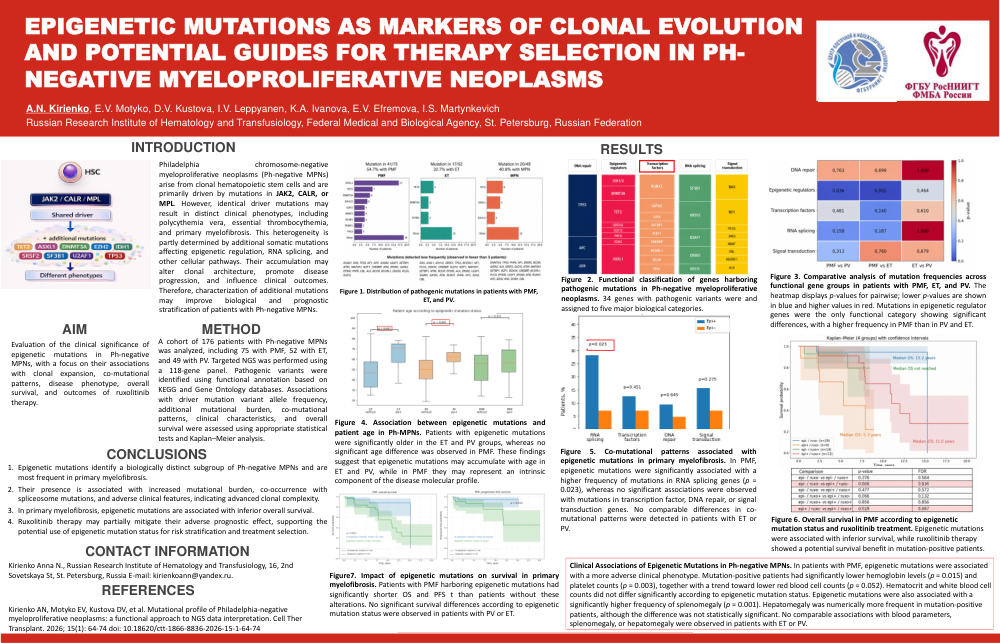
EPIGENETIC MUTATIONS AS MARKERS OF CLONAL EVOLUTION
AND POTENTIAL GUIDES FOR THERAPY SELECTION IN PH-NEGATIVE MYELOPROLIFERATIVE NEOPLASMS
A.N. Kirienko, E.V. Motyko, D.V. Kustova, I.V. Leppyanen, K.A. Ivanova, E.V. Efremova, I.S. Martynkevich
Russian Research Institute of Hematology and Transfusiology, Federal Medical and Biological Agency, St. Petersburg, Russian Federation
INTRODUCTION
Philadelphia chromosome-negative myeloproliferative neoplasms (Ph-negative MPNs) arise from clonal hematopoietic stem cells and are primarily driven by mutations in JAK2, CALR, or MPL. However, identical driver mutations may result in distinct clinical phenotypes, including polycythemia vera, essential thrombocythemia, and primary myelofibrosis. This heterogeneity is partly determined by additional somatic mutations affecting epigenetic regulation, RNA splicing, and other cellular pathways. Their accumulation may alter clonal architecture, promote disease progression, and influence clinical outcomes. Therefore, characterization of additional mutations may improve biological and prognostic stratification of patients with Ph-negative MPNs.
AIM
Evaluation of the clinical significance of epigenetic mutations in Ph-negative MPNs, with a focus on their associations with clonal expansion, co-mutational patterns, disease phenotype, overall survival, and outcomes of ruxolitinib therapy.
METHOD
A cohort of 176 patients with Ph-negative MPNs was analyzed, including 75 with PMF, 52 with ET, and 49 with PV. Targeted NGS was performed using a 118-gene panel. Pathogenic variants were identified using functional annotation based on KEGG and Gene Ontology databases. Associations with driver mutation variant allele frequency, additional mutational burden, co-mutational patterns, clinical characteristics, and overall survival were assessed using appropriate statistical tests and Kaplan–Meier analysis.
RESULTS
Figure 1 chart text
Mutation in 41/75 — 54.7% with PMF
PMF:
ASXL1 — 17
TET2 — 7
DNMT3A — 6
IDH1/2 — 5
EZH2 — 4
SRSF2 — 4
SF3B1 — 4
RUNX1 — 3
TP53 — 3
Other — 19
Number of patients
Mutation in 17/52 — 32.7% with ET
ET:
TET2 — 5
DNMT3A — 3
SF3B1 — 3
Other — 12
Number of patients
Mutation in 20/49 — 40.8% with MPN
MPN:
TET2 — 6
ASXL1 — 5
IDH1/2 — 3
Other — 12
Number of patients
Mutations detected less frequently (observed in fewer than 3 patients):
PMF: RUNX1, RAS, TP53, NF1, APC, SH2B3, U2AF1, SETBP1, ATRX, MAP2K1, IKZF1, CREBBP, ATM, ZRSR2, GATA2, EP300, PHF6, CBL, ALK, BCOR, BCORL1, DDX3X, PLCG, SUZ12.
ET: RAS, ASXL1, IDH1/2, SRSF2, TP53, BCORL1, NF1, PLCG, DDX3X, CREBBP, SUZ12, IKZF1, MAP2K1, SETBP1, ATRX, BCOR, EP300, ALK, ZRSR2, U2AF1, SH2B3, GATA2, ATM, RUNX1, PHF6, APC, EZH2, CBL.
PV: DNMT3A, TP53, PHF6, NF1, ZRSR2, BCOR, GATA2, ALK, SRSF2, SUZ12, ATRX, MAP2K1, SETBP1, IKZF1, DDX3X, CREBBP, BCORL1, PLCG, EP300, U2AF1, SH2B3, ATM, RUNX1, APC, EZH2, RAS, SF3B1, CBL.
Figure 1. Distribution of pathogenic mutations in patients with PMF, ET, and PV.
Figure 2 chart text
DNA repair: TP53, APC, ATM.
Epigenetic regulators: IDH1/2, DNMT3A, TET2, ARID1A, SUZ12, PHF6, EZH2, ASXL1.
Transcription factors: RUNX1, GATA2, CIITA, SETBP1, IKZF1, CREBBP, BCORL1, BCOR, MGA.
RNA splicing: SF3B1, SRSF2, U2AF1, ZRSR2, DDX3X.
Signal transduction: RAS, NF1, PLCG, JAK3, BRAF, CBL, MAP2K1, ALK.
Figure 2. Functional classification of genes harboring pathogenic mutations in Ph-negative myeloproliferative neoplasms. 34 genes with pathogenic variants were and assigned to five major biological categories.
Figure 3 chart text
p-value
PMF vs PV | PMF vs ET | ET vs PV
DNA repair: 0.703 | 0.699 | 1.000
Epigenetic regulators: 0.036 | 0.002 | 0.464
Transcription factors: 0.481 | 0.140 | 0.610
RNA splicing: 0.158 | 0.187 | 1.000
Signal transduction: 0.313 | 0.760 | 0.679
Figure 3. Comparative analysis of mutation frequencies across functional gene groups in patients with PMF, ET, and PV. The heatmap displays p-values for pairwise; lower p-values are shown in blue and higher values in red. Mutations in epigenetic regulator genes were the only functional category showing significant differences, with a higher frequency in PMF than in PV and ET.
Figure 4 chart text
Patient age according to epigenetic mutation status
ET without / ET epi+ — p = 0.007
PV without / PV epi+ — p = 0.005
PMF without / PMF epi+ — p = 0.311
Figure 4. Association between epigenetic mutations and patient age in Ph-MPNs. Patients with epigenetic mutations were significantly older in the ET and PV groups, whereas no significant age difference was observed in PMF. These findings suggest that epigenetic mutations may accumulate with age in ET and PV, while in PMF they may represent an intrinsic component of the disease molecular profile.
Figure 5 chart text
Patients, %
Epi+ / Epi−
RNA splicing — p = 0.023
Transcription factors — p = 0.451
DNA repair — p = 0.645
Signal transduction — p = 0.275
Figure 5. Co-mutational patterns associated with epigenetic mutations in primary myelofibrosis. In PMF, epigenetic mutations were significantly associated with a higher frequency of mutations in RNA splicing genes (p = 0.023), whereas no significant associations were observed with mutations in transcription factor, DNA repair, or signal transduction genes. No comparable differences in co-mutational patterns were detected in patients with ET or PV.
Figure 6 chart text
Kaplan–Meier (4 groups) with confidence intervals
Survival probability
Time, years
epi− / ruxo− (n = 29): Median OS: 15.2 years
epi+ / ruxo− (n = 9): Median OS: 5.3 years
epi− / ruxo+ (n = 14): Median OS not reached
epi+ / ruxo+ (n = 23): Median OS: 11.0 years
Comparison | p-value | FDR
epi− / ruxo− vs epi− / ruxo+ | 0.376 | 0.564
epi− / ruxo− vs epi+ / ruxo− | 0.006 | 0.036
epi− / ruxo− vs epi+ / ruxo+ | 0.477 | 0.572
epi− / ruxo+ vs epi+ / ruxo− | 0.066 | 0.132
epi− / ruxo+ vs epi+ / ruxo+ | 0.856 | 0.856
epi+ / ruxo− vs epi+ / ruxo+ | 0.029 | 0.087
Figure 6. Overall survival in PMF according to epigenetic mutation status and ruxolitinib treatment. Epigenetic mutations were associated with inferior survival, while ruxolitinib therapy showed a potential survival benefit in mutation-positive patients.
Figure 7 chart text
PMF: overall survival
p = 0.0013
No epigenetic mutations: median 15.2 years
Epigenetic mutations: median 10.8 years
No epigenetic mutations (n = 43)
Epigenetic mutations (n = 32)
Survival probability
Time, years
PMF: progression-free survival
p = 0.013
No epigenetic mutations: median not reached
Epigenetic mutations: median 11.8 years
No epigenetic mutations (n = 43)
Epigenetic mutations (n = 32)
Progression-free probability
Time, years
Figure 7. Impact of epigenetic mutations on survival in primary myelofibrosis. Patients with PMF harboring epigenetic mutations had significantly shorter OS and PFS than patients without these alterations. No significant survival differences according to epigenetic mutation status were observed in patients with PV or ET.
Clinical Associations of Epigenetic Mutations in Ph-negative MPNs. In patients with PMF, epigenetic mutations were associated with a more adverse clinical phenotype. Mutation-positive patients had significantly lower hemoglobin levels (p = 0.015) and platelet counts (p = 0.003), together with a trend toward lower red blood cell counts (p = 0.052). Hematocrit and white blood cell counts did not differ significantly according to epigenetic mutation status. Epigenetic mutations were also associated with a significantly higher frequency of splenomegaly (p = 0.001). Hepatomegaly was numerically more frequent in mutation-positive patients, although the difference was not statistically significant. No comparable associations with blood parameters, splenomegaly, or hepatomegaly were observed in patients with ET or PV.
CONCLUSIONS
1. Epigenetic mutations identify a biologically distinct subgroup of Ph-negative MPNs and are most frequent in primary myelofibrosis.
2. Their presence is associated with increased mutational burden, co-occurrence with spliceosome mutations, and adverse clinical features, indicating advanced clonal complexity.
3. In primary myelofibrosis, epigenetic mutations are associated with inferior overall survival.
4. Ruxolitinib therapy may partially mitigate their adverse prognostic effect, supporting the potential use of epigenetic mutation status for risk stratification and treatment selection.
CONTACT INFORMATION
Kirienko Anna N., Russian Research Institute of Hematology and Transfusiology, 16, 2nd Sovetskaya St, St. Petersburg, Russia. E-mail: kirienkoann@yandex.ru.
REFERENCES
Kirienko AN, Motyko EV, Kustova DV, et al. Mutational profile of Philadelphia-negative myeloproliferative neoplasms: a functional approach to NGS data interpretation. Cell Ther Transplant. 2026; 15(1): 64–74. doi: 10.18620/ctt-1866-8836-2026-15-1-64-74