875 posters, 25 topics, 3,440 authors, 1,061 institutions
ePostersLive by SciGen Technologies S.A. All rights reserved.
SAGES 2026 Annual Meeting Emerging Technology Session
March 25-28, 2026 | Tampa, FL, USA

P318
Distribution of Certified Bariatric Surgery Centers: Are We Meeting the Needs of the People?
Poster Presenter
Part of Topic
Bariatric
Introduction:
• Obesity rates continue to rise, exceeding 20% in all states.
• $147 billion per year in direct medical costs.
• Fails to include lost productivity and disability due to secondary diseases.
• Poor evaluation of cost due to social stigmatization, difficulty accessing public spaces, and disparities in healthcare quality.
• Surgery remains a durable option for sustainable weight loss.
• State-level variability in obesity rates.
• State-level variability in MBSAQIP certified bariatric surgical centers.
We hypothesize that the geographic availability of surgical centers may not be meeting the needs of the population.
Methods:
• Using obesity prevalence and number of adults per state, calculate number of obese individuals per state
• Using MBSAQIP, identify the certified adult centers, medically accredited, and ambulatory centers per state
• Calculate certified centers per 100,000 obese individuals
• Calculate national mean center density and each state's standard deviations from the mean
Results:
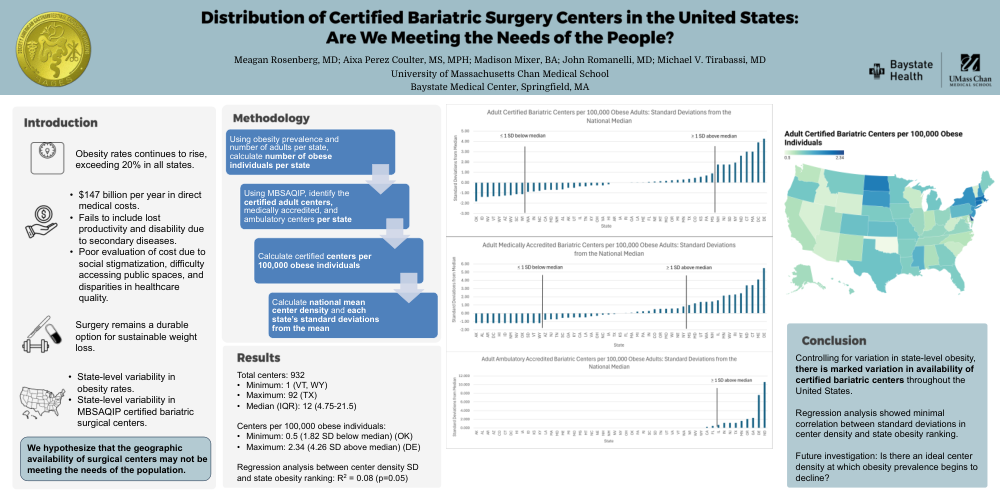
Total centers: 932
• Minimum: 1 (VT, WY)
• Maximum: 92 (TX)
• Median (IQR): 12 (4.75-21.5)
Centers per 100,000 obese individuals:
• Minimum: 0.5 (1.82 SD below median) (OK)
• Maximum: 2.34 (4.26 SD above median) (DE)
Conclusion:
• Controlling for variation in state-level obesity, there is marked variation in availability of certified bariatric centers throughout the United States.
• Regression analysis showed minimal correlation between standard deviations in center density and state obesity ranking.
• Future investigation: Is there an ideal center density at which obesity prevalence begins to decline?