296 posters, 7 videos, 13 audios, 14 topics, 10 sessions, 1,019 authors, 260 institutions
ePostersLive by SciGen Technologies S.A. All rights reserved.
RCOphth Annual Congress 2026
18 - 21 May, 2026 | Manchester Central, Manchester

P027
The Mathematics of Follow-Ups: Small Changes at Patient Level Create Large System-Level Effects
Poster Presenter
Authors
Part of Topic
Audit and clinical governance
The NHS does not have a capacity problem: reframing outpatient pressure as a demand–capacity mismatch using a polling model of follow-up
Authors
Ffion Brown, Ahmed Al-Janabi, Kevin Gallagher
Cwm Taf Morgannwg University Health Board
Background
Outpatient pressure is commonly framed as a capacity problem. Reframing this as a demand–capacity mismatch expands the solution space: capacity can be increased, but demand can also be modified.
A large proportion of ophthalmology outpatient demand is generated by follow-up scheduling decisions. Many drivers of demand (e.g. ageing population, increasing chronic disease prevalence) are not modifiable, but follow-up interval is a key controllable determinant.
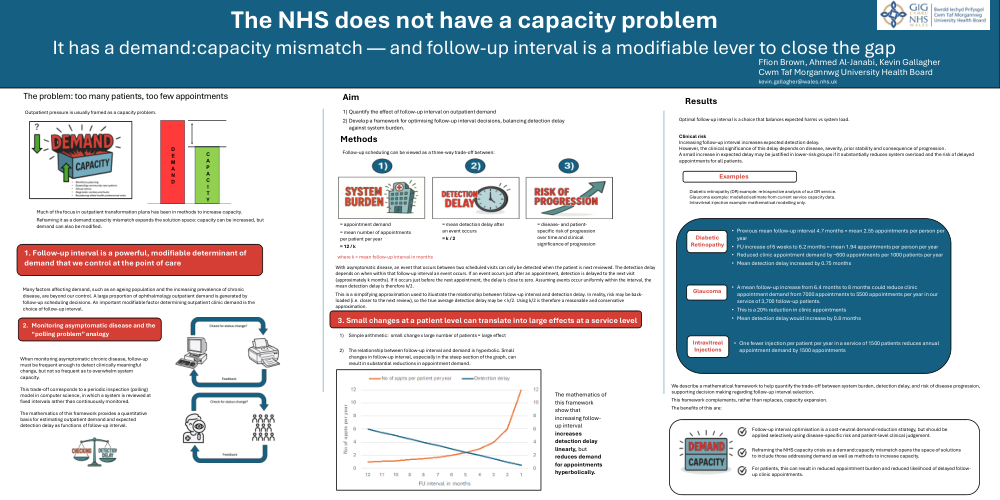
When monitoring asymptomatic chronic disease, follow-up must be frequent enough to detect clinically meaningful change, but not so frequent as to overwhelm system capacity. This trade-off corresponds to a periodic inspection (polling) model, in which a system is reviewed at fixed intervals rather than continuously monitored.
This framework provides a quantitative basis for estimating outpatient demand and expected detection delay as functions of follow-up interval.
Aim
To quantify the relationship between follow-up interval, outpatient demand, and detection delay, and to provide a framework to support follow-up interval optimisation.
Methods
Follow-up interval k (months) determines:
Appointment demand (appointments per patient per year): 12 / k
Mean detection delay after an event: k / 2 (assuming events occur uniformly within the interval)
These relationships were used to model the trade-off between system burden and delay in detection of disease progression.
Illustrative examples were derived from diabetic retinopathy, glaucoma, and intravitreal injection services using local and modelled data.
Results
Increasing follow-up interval increases detection delay linearly, but reduces outpatient demand hyperbolically.
Small increases in follow-up interval at the individual level translate into large reductions in system demand:
Increasing follow-up from 4.7 to 6.2 months reduced demand from 2.55 to 1.94 appointments per patient per year (~600 fewer appointments per 1000 patients annually), with a mean increase in detection delay of 0.75 months
Increasing follow-up from 6.4 to 8 months in a service of 3,700 patients reduced annual appointments from 7,000 to 5,500 (~20% reduction), with a mean delay increase of 0.8 months
In injection services, one fewer injection per patient per year reduces demand proportionally (e.g. 1,500 fewer appointments in a 1,500-patient service)
Detection delay depends on when an event occurs within the interval; assuming a uniform distribution, the mean delay is k/2. This represents a simplifying approximation; if risk is back-loaded, the true delay may be lower.
Conclusions
Follow-up interval is a powerful, modifiable determinant of outpatient demand.
A simple mathematical framework based on a periodic inspection model demonstrates that modest increases in follow-up interval can substantially reduce service demand, with relatively small increases in expected detection delay.
Optimal follow-up interval selection represents a balance between expected clinical harm and system burden, and should be guided by disease-specific risk, patient factors, and service constraints.
Reframing outpatient pressure as a demand–capacity mismatch enables cost-neutral strategies to reduce demand alongside efforts to increase capacity.