301 posters, 50 videos, 13 topics, 13 sessions, 734 authors, 193 institutions
ePostersLive by SciGen Technologies S.A. All rights reserved.
ISMICS 2026 Annual Meeting
10 - 13 June, 2026 | Miami, Florida

P72
The Risk Of Early Discharge Following Mitral Valve Repair
Poster Presenter
Part of Topic
ERAS
The Risk of Early Discharge Following Mitral Valve Repair
Andres Martinez Plotnikow, BS1, Lily G. Bessette, MS1, Johannes Bonatti, MD1, Xander Jacquemyn, MD1, Anvith Ramadugu, BS1, Yisi Wang, MPH2, Floyd Thoma, BS1, Takuya Ogami, MD1, Ibrahim Sultan, MD1, Irsa S. Hasan, MD1
1 University of Pittsburgh, Pittsburgh, PA, USA
2University of Pittsburgh MedicalCenter, Pittsburgh, PA, USA
INTRODUCTION
•Isolated mitral valve repair (MVr) in the modern era is performed with remarkably low morbidity and mortality, which has led to reduced hospital length of stay. However, the safety of early post-operative discharge with respect to readmission and mortality remains uncertain.
•Objective: To compare 30-day postoperative outcomes between patients discharged early (≤3 days) versus late (>3 days) following elective isolated MVr surgery.
•Hypothesis: Early discharge after cardiac surgery is not associated with an increased risk of major adverse events in the immediate postoperative period, at 30 days, or at 1 year.
METHODS
•Data: Observational cohort study using a prospectively maintained cardiac surgery database from a multihospital academic health system.
•Study population: Adults (≥18 years) undergoing elective isolated MVrsurgery discharged home alive between 2010–2025.
•Exclusion criteria: EF <20% or STS PROM >8%.
•Exposure: Early (≤3 days) vs. late (>3 days) post-operative discharge.
•Outcomes: Major adverse cardiac andcerebrovascular events (MACCE) at 30 days and 1 year postoperatively. Secondary outcomes include perioperative events, death, readmission, and atrial fibrillation.
•Statistical analysis: Propensity score matching, followed by Poisson regression (MACCE) and McNemar’s test (secondary outcomes).
|
Table 1. Propensity scored matched patient characteristics |
|||
|
Early discharge (Before PSM N = 110; After 1:1 PSM N = 109) |
Late discharge (Before PSM N = 789; After 1:1 PSM N = 109)
|
SMD |
|
|
Age; median (Q1-Q3) |
57.0 (47.0-65.0) |
58.0 (48.0-65.0) |
0.05 |
|
Female; n (%) |
32 (29.4%) |
36 (33.0%) |
0.08 |
|
Diabetes mellitus; n (%) |
4 (3.7%) |
6 (5.5%) |
0.08 |
|
Hypertension; n (%) |
54 (49.5%) |
60 (55.0%) |
0.10 |
|
Arrhythmia; n (%) |
7 (6.4%) |
4 (3.7%) |
0.12 |
|
Ejection fraction; median (Q1-Q3) |
0.4 (0.3-0.6) |
0.4 (0.3-0.6) |
0.01 |
|
Preoperative estimated glomerular filtration rate (ml/min/1.73m2); median (Q1-Q3) |
60.0 (55.0-63.0) |
58.0 (55.0-63.0) |
0.10 |
|
BMI (kg/m2); median (Q1-Q3) |
91.2 (81.8-101) |
91.9 (77.0-101) |
0.07 |
|
STS Risk Score; median (Q1-Q3) |
25.7 (22.7-28.1) |
25.4 (22.7-28.0) |
0.03 |
|
Table 2. Perioperative outcomes |
|||
|
Early discharge (N = 109) |
Late discharge (N = 109) |
P-value |
|
|
Post-operative stroke; n (%) |
0 (0.0%) |
0 (0.0%) |
NA |
|
Re-operation for bleeding; n (%) |
1 (0.9%) |
2 (1.8%) |
0.561 |
|
Re-operation; n (%) |
2 (1.8%) |
3 (2.8%) |
0.651 |
|
Renal failure; n (%) |
0 (0.0%) |
0 (0.0%) |
NA |
|
Post-operative pacemaker implantation; n (%) |
0 (0.0%) |
1 (0.9%) |
0.316 |
|
Lower extremity paralysis; n (%) |
0 (0.0%) |
0 (0.0%) |
NA |
|
Table 3. Postoperative outcomes |
|||
|
Early discharge (N = 109) |
Late discharge (N = 109) |
P-value |
|
|
MACCE at 30 days; n (%) |
5 (4.6%) |
5 (4.6%) |
1 |
|
MACCE at 1 year; n (%) |
8 (7.3%) |
13 (11.9%) |
0.251 |
|
Any readmission at 30 days; n (%) |
7 (6.4%) |
12 (11.0%) |
0.23 |
|
Any readmission at 1 year; n (%) |
10 (9.2%) |
19 (17.4%) |
0.073 |
|
All-cause mortality at 30 days; n (%) |
0 (0.0%) |
0 (0.0%) |
NA |
|
All-cause mortality at 1 year; n (%) |
0 (0.0%) |
0 (0.0%) |
NA |
|
Atrial fibrillation at 30 days; n (%) |
1 (0.9%) |
0 (0.0%) |
0.316 |
|
Atrial fibrillation at 1 year; n (%) |
2 (1.8%) |
2 (1.8%) |
1 |
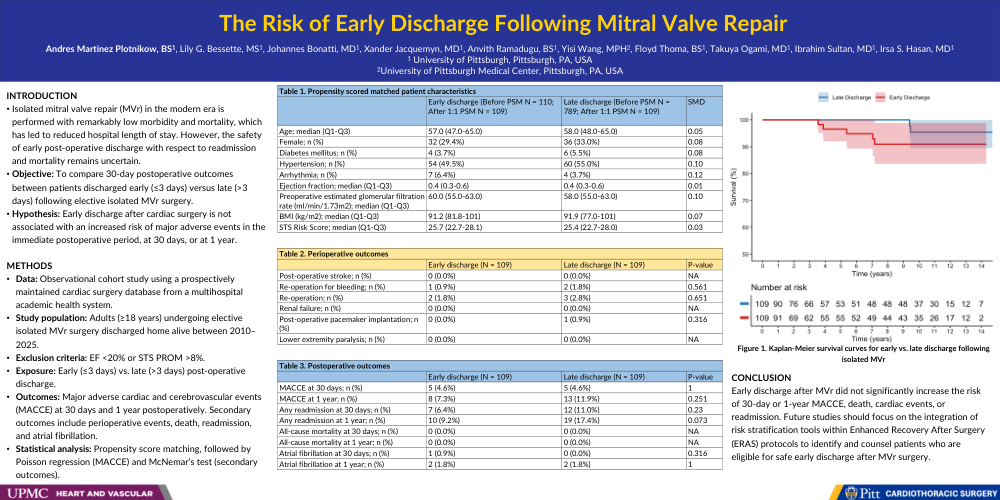
Figure 1. Kaplan-Meier survival curves for early vs. late discharge following isolated MVr
CONCLUSION
Early discharge after MVr did not significantly increase the risk of 30-day or 1-year MACCE, death, cardiac events, or readmission. Future studies should focus on the integration of risk stratification tools within Enhanced Recovery After Surgery (ERAS) protocols to identify and counsel patients who are eligible for safe early discharge after MVr surgery.