1,267 posters, 47 videos, 13 topics, 4 sessions, 853 authors
ePostersLive by SciGen Technologies S.A. All rights reserved.
SOHO 2026 Annual Meeting
September 9 - 12, 2026 | George R. Brown Convention Center, Houston, Texas

MDS - 1121
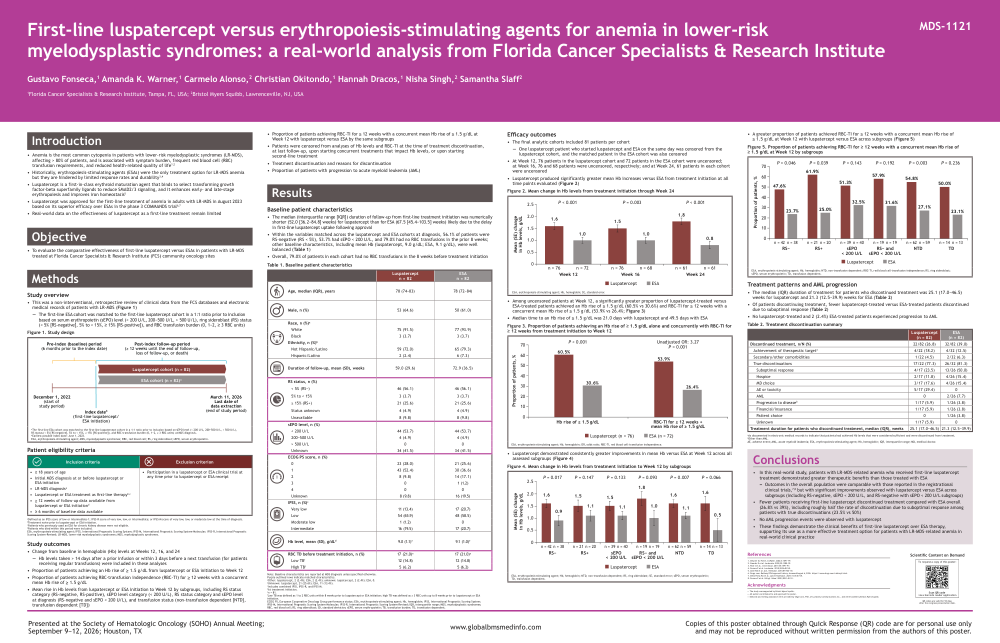
First-Line (1L) Luspatercept Versus Erythropoiesis-Stimulating Agents (ESAs) for Anemia in Lower-Risk Myelodysplastic Syndromes (LR-MDS): A Real-World Analysis from Florida Cancer Specialists & Research Institute (FCS)
Poster Presenter
Authors
Part of Topic
Myelodysplastic Syndromes (MDS)
Introduction
• Anemia is the most common cytopenia in patients with lower-risk myelodysplastic syndromes (LR-MDS),
affecting > 80% of patients, and is associated with symptom burden, frequent red blood cell (RBC)
transfusion requirements, and reduced health-related quality of life1,2
• Historically, erythropoiesis-stimulating agents (ESAs) were the only treatment option for LR-MDS anemia
but they are hindered by limited response rates and durability3,4
• Luspatercept is a first-in-class erythroid maturation agent that binds to select transforming growth
factor-beta superfamily ligands to reduce SMAD2/3 signaling, and it enhances early- and late-stage
erythropoiesis and improves iron homeostasis5
• Luspatercept was approved for the first-line treatment of anemia in adults with LR-MDS in August 2023
based on its superior efficacy over ESAs in the phase 3 COMMANDS trial6,7
• Real-world data on the effectiveness of luspatercept as a first-line treatment remain limited
Objective
• To evaluate the comparative effectiveness of first-line luspatercept versus ESAs in patients with LR-MDS
treated at Florida Cancer Specialists & Research Institute (FCS) community oncology sites
Methods
Study overview
• This was a non-interventional, retrospective review of clinical data from the FCS databases and electronic
medical records of patients with LR-MDS (Figure 1)
— The first-line ESA cohort was matched to the first-line luspatercept cohort in a 1:1 ratio prior to inclusion
based on serum erythropoietin (sEPO) level (< 200 U/L, 200-500 U/L, > 500 U/L), ring sideroblast (RS) status
(< 5% [RS-negative], 5% to < 15%, ≥ 15% [RS-positive]), and RBC transfusion burden (0, 1-2, ≥ 3 RBC units)
Figure 1. Study design
| December 1, 2022(start ofstudy period)Index dateb(first-line luspatercept/ESA initiation)March 11, 2026Last date ofdata extraction(end of study period)Pre-index (baseline) period(6 months prior to the index date)Post-index follow-up period(≥ 12 weeks until the end of follow-up,loss of follow-up, or death)Luspatercept cohort (n = 82)ESA cohort (n = 82)a |
| aThe first-line ESA cohort was matched to the first-line luspatercept cohort in a 1:1 ratio prior to inclusion based on sEPO level (< 200 U/L, 200-500 U/L, > 500 U/L),RS status (< 5% [RS-negative], 5% to < 15%, ≥ 15% [RS-positive]), and RBC transfusion burden (0, 1-2, ≥ 3 RBC units) at MDS diagnosis.bEarliest possible index date: June 1, 2023.ESA, erythropoiesis-stimulating agent; MDS, myelodysplastic syndromes; RBC, red blood cell; RS, ring sideroblast; sEPO, serum erythropoietin. |
Patient eligibility criteria
| Inclusion criteria | Exclusion criterion |
| • ≥ 18 years of age• Initial MDS diagnosis at or before luspatercept orESA initiation• LR-MDS diagnosisa• Luspatercept or ESA treatment as first-line therapyb,c• ≥ 12 weeks of follow-up data available fromluspatercept or ESA initiationd• ≥ 6 months of baseline data available | • Participation in a luspatercept or ESA clinical trial atany time prior to luspatercept or ESA receipt |
aDefined as an IPSS score of low or intermediate-1; IPSS-R score of very low, low, or intermediate; or IPSS-M score of very low, low, or moderate low at the time of diagnosis.
bTreatment naive prior to luspatercept or ESA initiation.
cPatients who previously used an ESA for chronic kidney disease were not eligible.
dPatients who died within this period were included.
ESA, erythropoiesis-stimulating agent; IPSS, International Prognostic Scoring System; IPSS-M, International Prognostic Scoring System-Molecular; IPSS-R, International Prognostic
Scoring System-Revised; LR-MDS, lower-risk myelodysplastic syndromes; MDS, myelodysplastic syndromes.
Study outcomes
• Change from baseline in hemoglobin (Hb) levels at Weeks 12, 16, and 24
— Hb levels taken > 14 days after a prior infusion or within 3 days before a next transfusion (for patients
receiving regular transfusions) were included in these analyses
• Proportion of patients achieving an Hb rise of ≥ 1.5 g/dL from luspatercept or ESA initiation to Week 12
• Proportion of patients achieving RBC-transfusion independence (RBC-TI) for ≥ 12 weeks with a concurrent
mean Hb rise of ≥ 1.5 g/dL
• Mean rise in Hb levels from luspatercept or ESA initiation to Week 12 by subgroups, including RS status
category (RS-negative, RS-positive), sEPO level category (< 200 U/L), RS status category and sEPO level
at diagnosis (RS-negative and sEPO < 200 U/L), and transfusion status (non-transfusion dependent [NTD],
transfusion dependent [TD])
• Proportion of patients achieving RBC-TI for ≥ 12 weeks with a concurrent mean Hb rise of ≥ 1.5 g/dL at
Week 12 with luspatercept versus ESA by the same subgroups
• Patients were censored from analyses of Hb levels and RBC-TI at the time of treatment discontinuation,
at last follow-up, upon starting concurrent treatments that impact Hb levels, or upon starting
second-line treatment
• Treatment discontinuation and reasons for discontinuation
• Proportion of patients with progression to acute myeloid leukemia (AML)
Results
Baseline patient characteristics
• The median (interquartile range [IQR]) duration of follow-up from first-line treatment initiation was numerically
shorter (52.0 [36.2-84.8] weeks) for luspatercept than for ESA (67.5 [45.4-103.5] weeks) likely due to the delay
in first-line luspatercept uptake following approval
• Within the variables matched across the luspatercept and ESA cohorts at diagnosis, 56.1% of patients were
RS-negative (RS < 5%), 53.7% had sEPO < 200 U/L, and 79.0% had no RBC transfusions in the prior 8 weeks;
other baseline characteristics, including mean Hb (luspatercept, 9.0 g/dL; ESA, 9.1 g/dL), were well
balanced (Table 1)
• Overall, 79.0% of patients in each cohort had no RBC transfusions in the 8 weeks before treatment initiation
Efficacy outcomes
• The final analytic cohorts included 81 patients per cohort
— One luspatercept patient who started luspatercept and ESA on the same day was censored from the
luspatercept cohort, and the matched patient in the ESA cohort was also censored
• At Week 12, 76 patients in the luspatercept cohort and 72 patients in the ESA cohort were uncensored;
at Week 16, 76 and 68 patients were uncensored, respectively; and at Week 24, 61 patients in each cohort
were uncensored
• Luspatercept produced significantly greater mean Hb increases versus ESA from treatment initiation at all
time points evaluated (Figure 2)
Figure 2. Mean change in Hb levels from treatment initiation through Week 24
| 01.00.51.52.02.5Week 12 Week 16 Week 24Mean (SE) changein Hb levels, g/dLP < 0.001 P = 0.003 P < 0.001n = 76 n = 72 n = 76 n = 68 n = 61 n = 611.51.81.00.81.61.0Luspatercept ESA |
| ESA, erythropoiesis-stimulating agent; Hb, hemoglobin; SE, standard error. |
• Among uncensored patients at Week 12, a significantly greater proportion of luspatercept-treated versus
ESA-treated patients achieved an Hb rise of ≥ 1.5 g/dL (60.5% vs 30.6%) and RBC-TI for ≥ 12 weeks with a
concurrent mean Hb rise of ≥ 1.5 g/dL (53.9% vs 26.4%; Figure 3)
• Median time to an Hb rise of ≥ 1.5 g/dL was 21.0 days with luspatercept and 49.5 days with ESA
Figure 3. Proportion of patients achieving an Hb rise of ≥ 1.5 g/dL alone and concurrently with RBC-TI for
≥ 12 weeks from treatment initiation to Week 12
| 010203040506070Hb rise of ≥ 1.5 g/dL RBC-TI for ≥ 12 weeks +mean Hb rise of ≥ 1.5 g/dLProportion of patients, %P < 0.001 Unadjusted OR: 3.27P = 0.00160.5%53.9%30.6%26.4%Luspatercept (n = 76) ESA (n = 72) |
| ESA, erythropoiesis-stimulating agent; Hb, hemoglobin; OR, odds ratio; RBC-TI, red blood cell-transfusion independence. |
• Luspatercept demonstrated consistently greater improvements in mean Hb versus ESA at Week 12 across all
assessed subgroups (Figure 4)
Figure 4. Mean change in Hb levels from treatment initiation to Week 12 by subgroups
| 0.501.02.52.01.5RS- RS+ sEPO< 200 U/LRS- and NTDsEPO < 200 U/LTDMean (SE) changein Hb levels, g/dLP = 0.017 P = 0.147 P = 0.133 P = 0.093 P = 0.007 P = 0.066n = 42 n = 38 n = 21 n = 20 n = 39 n = 40 n = 19 n = 19 n = 62 n = 59 n = 14 n = 131.6 1.5 1.51.81.01.6 1.61.10.51.1 1.10.9Luspatercept ESA |
| ESA, erythropoiesis-stimulating agent; Hb, hemoglobin; NTD, non-transfusion dependent; RS, ring sideroblast; SE, standard error; sEPO, serum erythropoietin;TD, transfusion dependent. |
• A greater proportion of patients achieved RBC-TI for ≥ 12 weeks with a concurrent mean Hb rise of
≥ 1.5 g/dL at Week 12 with luspatercept versus ESA across subgroups (Figure 5)
Figure 5. Proportion of patients achieving RBC-TI for ≥ 12 weeks with a concurrent mean Hb rise of
≥ 1.5 g/dL at Week 12 by subgroups
| 010203040506070RS- RS+ sEPO< 200 U/LRS- andsEPO < 200 U/LNTD TDProportion of patients, %P = 0.046 P = 0.039 P = 0.143 P = 0.192 P = 0.003 P = 0.236n = 42 n = 38 n = 21 n = 20 n = 39 n = 40 n = 19 n = 19 n = 62 n = 59 n = 14 n = 1347.6%61.9%51.3%57.9%54.8%50.0%23.7% 25.0%32.5% 31.6%27.1%23.1%Luspatercept ESA |
| ESA, erythropoiesis-stimulating agent; Hb, hemoglobin; NTD, non-transfusion dependent; RBC-TI, red blood cell-transfusion independence; RS, ring sideroblast;sEPO, serum erythropoietin; TD, transfusion dependent. |
Treatment patterns and AML progression
• The median (IQR) duration of treatment for patients who discontinued treatment was 25.1 (17.0-46.5)
weeks for luspatercept and 21.3 (12.5-39.9) weeks for ESA (Table 2)
• Of patients discontinuing treatment, fewer luspatercept-treated versus ESA-treated patients discontinued
due to suboptimal response (Table 2)
• No luspatercept-treated and 2 (2.4%) ESA-treated patients experienced progression to AML
Table 2. Treatment discontinuation summary
| Luspatercept(n = 82) | ESA(n = 82) | |
| Discontinued treatment, n/N (%) | 22/82 (26.8) | 32/82 (39.0) |
| Achievement of therapeutic targeta | 4/22 (18.2) | 4/32 (12.5) |
| Secondary/other comorbidities | 1/22 (4.5) | 2/32 (6.3) |
| True discontinuations | 17/22 (77.3) | 26/32 (81.3) |
| Suboptimal response | 4/17 (23.5) | 13/26 (50.0) |
| Hospice | 2/17 (11.8) | 4/26 (15.4) |
| MD choice | 3/17 (17.6) | 4/26 (15.4) |
| AE or toxicity | 5/17 (29.4) | 0 |
| AML | 0 | 2/26 (7.7) |
| Progression to diseaseb | 1/17 (5.9) | 1/26 (3.8) |
| Financial/insurance | 1/17 (5.9) | 1/26 (3.8) |
| Patient choice | 0 | 1/26 (3.8) |
| Unknown | 1/17 (5.9) | 0 |
| Treatment duration for patients who discontinued treatment, median (IQR), weeks | 25.1 (17.0-46.5) | 21.3 (12.5-39.9) |
aAs documented in electronic medical records to indicate that patients had achieved Hb levels that were considered sufficient and were discontinued from treatment.
bOther than AML.
AE, adverse event; AML, acute myeloid leukemia; ESA, erythropoiesis-stimulating agent; Hb, hemoglobin; IQR, interquartile range; MD, medical doctor.
Conclusions
• In this real-world study, patients with LR-MDS–related anemia who received first-line luspatercept
treatment demonstrated greater therapeutic benefits than those treated with ESA
– Outcomes in the overall population were comparable with those reported in the registrational
clinical trials,7,8 but with significant improvements observed with luspatercept versus ESA across
subgroups (including RS-negative, sEPO < 200 U/L, and RS-negative with sEPO < 200 U/L subgroups)
• Fewer patients receiving first-line luspatercept discontinued treatment compared with ESA overall
(26.8% vs 39%), including roughly half the rate of discontinuation due to suboptimal response among
patients with true discontinuations (23.5% vs 50%)
• No AML progression events were observed with luspatercept
• These findings demonstrate the clinical benefits of first-line luspatercept over ESA therapy,
supporting its use as a more effective treatment option for patients with LR-MDS–related anemia in
real-world clinical practice